Unlock Growth: Using Business Reports to Understand Your Service Business

Running a service-based business, whether you're a coach, tutor, consultant, or other professional, involves juggling many tasks. You're focused on delivering value to your clients, managing your schedule, and finding new opportunities. In the midst of it all, it can be easy to overlook a critical component of sustainable growth: understanding your business's performance through data.
Business reports aren't just for large corporations. For independent professionals and small teams, they offer invaluable insights that can guide your decisions, highlight what's working, and reveal areas needing attention. Think of reports as your business's health check – they show you how things are truly going, beyond just your intuition.
So, what kind of data is helpful, and how can you use it?
Key Metrics to Track in Your Service Business
While every business is unique, several core metrics provide a solid foundation for understanding performance. Focusing on these can help you see trends and make informed choices.
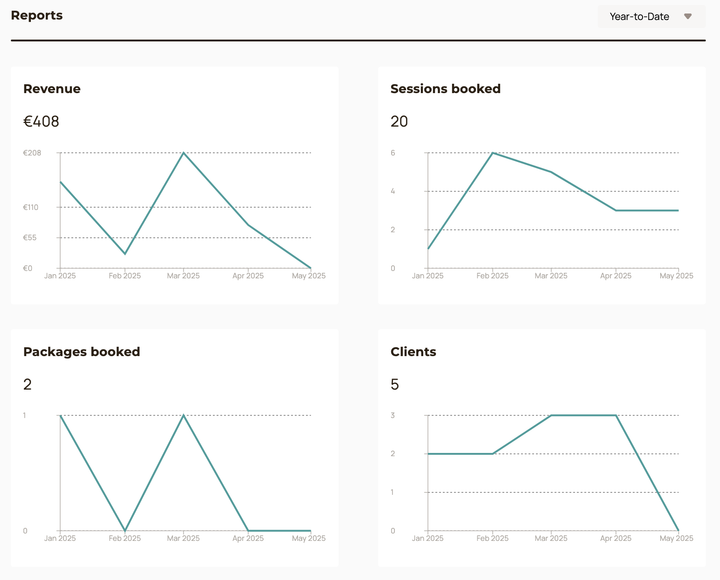
- Revenue: At its core, revenue tells you the total income your business is generating. Tracking this over time allows you to see periods of growth, seasonality, or dips that might require investigation. Understanding where your revenue comes from (e.g., specific services, packages) adds another layer of insight.
- Sessions Booked: For businesses based on appointments or sessions, tracking the number of sessions booked is a direct measure of activity. Is the number increasing or decreasing? Are there specific times or days that are more popular? This can inform your scheduling and availability.
- Packages Booked: If you offer service packages, monitoring their booking trends helps you understand which offerings are most popular. This data can inform future package development, pricing strategies, or marketing efforts for less popular options.
- Unique Clients: Growing your client base is often a goal. Tracking the number of unique clients over time shows you your reach and client acquisition trends. Is your marketing bringing in new people? Are you retaining existing clients?
Turning Data into Actionable Insights
Having the data is the first step; the real value comes from using it to make decisions. Reports with clear charts and graphs make it easier to spot trends and patterns quickly.
- Identify Trends: Look at your reports over customizable date ranges (weekly, monthly, quarterly, annually). Are revenue or session bookings consistently increasing? Did a recent marketing effort correlate with a spike in new clients? Identifying these trends helps you understand the impact of your actions. For example, if you see a consistent increase in session bookings after launching a new service, you know that initiative was successful. If revenue dips in summer months, you can plan for seasonal adjustments.
- Spot Anomalies: Did revenue suddenly drop in a specific month? Was there an unexpected peak in package bookings? Investigate these anomalies. They could point to external factors, the success or failure of a recent initiative, or an issue needing resolution.
- Understand Client Behavior: By looking at sessions and packages booked alongside unique clients, you can start to understand client engagement. For instance, are clients who book a discovery call more likely to book a full package? Are clients booking one-off sessions or committing to packages? This can inform your service offerings and sales approach.
- Forecast and Plan: Historical data provides a basis for future planning. If you see consistent growth trends, you might plan to invest more in marketing or expand your services. If you notice seasonal dips, you can prepare for them.
- Measure the Impact of Changes: When you implement a new strategy – like launching a new service, changing your pricing, or running a promotion – use your reports to measure its effect on revenue, bookings, and client numbers. This feedback loop is crucial for refining your approach.
Making Reporting Accessible
The idea of diving into data might seem daunting, but many tools designed for service professionals aim to make it straightforward. The right platform takes the complexity out of tracking, automatically collecting data and presenting it in clear, visual formats like charts and graphs, saving you time and effort. The ability to customize date ranges is also key, allowing you to analyze performance over periods relevant to your business cycles.
Regularly reviewing your business reports, even just for a few minutes each week or month, can provide clarity and confidence. It moves you from guessing about your business's health to knowing, enabling you to make more strategic decisions for sustainable growth.
Putting Reporting into Practice
Understanding your business's performance through data is a powerful step toward sustainable growth. While you can track metrics manually, using a platform designed for service professionals can significantly simplify the process. Tools that offer built-in reporting for key metrics like revenue, sessions booked, packages booked, and unique clients, often with customizable date ranges and easy-to-read charts, can save you time and provide immediate insights.
By leveraging accessible reporting features, you can gain a clearer picture of your business's journey and make more informed decisions to help you navigate the path ahead with greater insight and confidence.